Cap Rate Comparison Tool — Compare Properties Like a Pro
Stop evaluating properties one at a time. Use this cap rate comparison tool to stack up to 10 deals side-by-side with automated NOI calculations and sensitivity analysis.
Everything You Need to Compare Cap Rates
Input your numbers, and this cap rate comparison tool calculates NOI, cap rate, and cash-on-cash return for every property automatically.
Cap Rate Comparison Tool
Side-by-side analysis for up to 10 properties. Automated NOI calculations, sensitivity analysis, and visual charts for quick decision-making.
- ✓ Compare up to 10 properties side-by-side
- ✓ Automated NOI and cap rate calculations
- ✓ Cash-on-cash return for each property
- ✓ Sensitivity analysis (vacancy, expenses, rent)
- ✓ Visual charts for quick comparison
- ✓ Color-coded ranking dashboard
- ✓ Built in Excel & Google Sheets — no software needed
- ✓ Pre-loaded demo data to get started fast
See What’s Inside
Clean layout, automated formulas, and visual charts that make comparison effortless.
How the Cap Rate Comparison Tool Works
From input to decision in under 10 minutes.
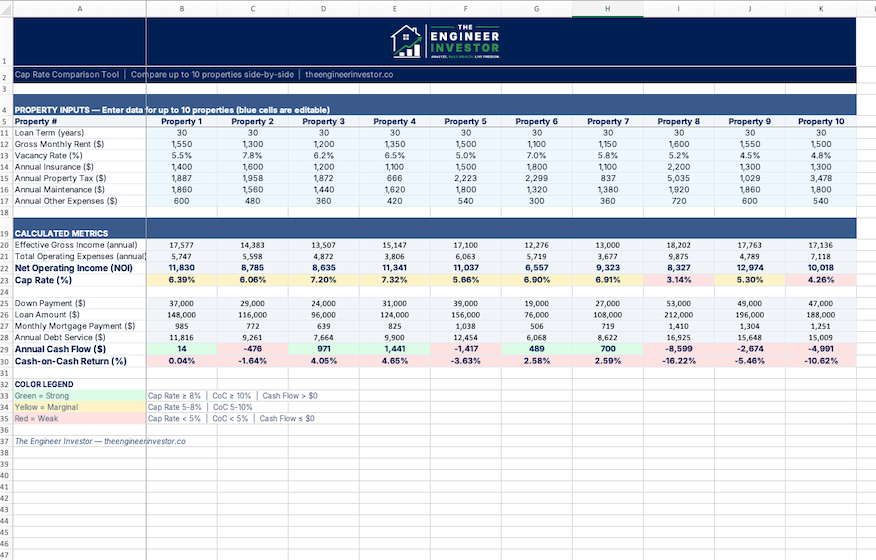
Enter Property Data
Plug in purchase price, gross rent, and operating expenses for each property. Blue-highlighted cells show you exactly where to input.
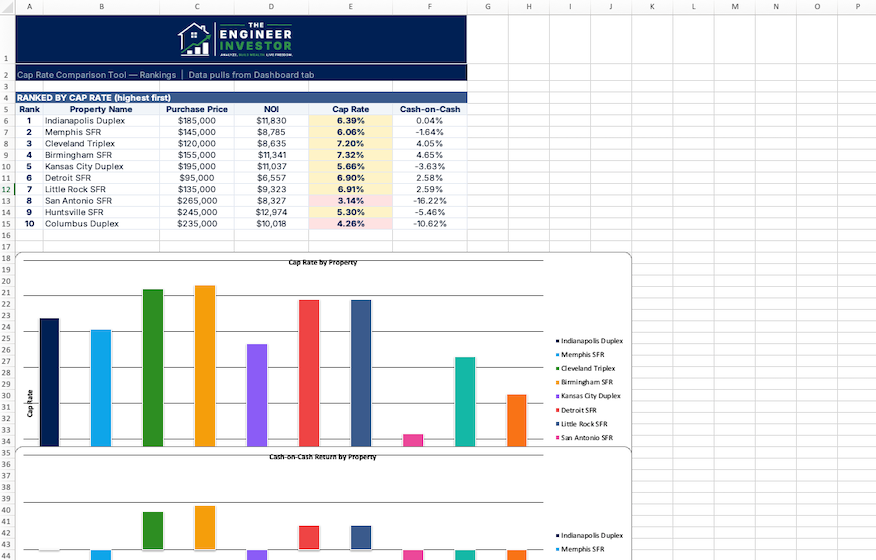
Review the Rankings
NOI, cap rate, and cash-on-cash return auto-calculate for every property. The ranking dashboard shows your best deals at a glance.
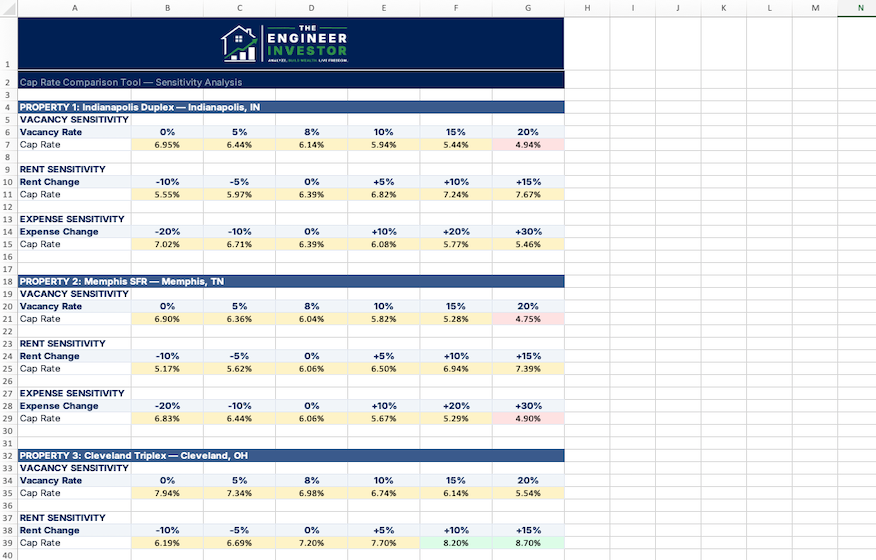
Run Scenarios
Use the sensitivity analysis to see how changes in vacancy, expenses, or rent affect each property’s cap rate and returns.
Built for Investors Who Compare Before They Commit
Deal hunters evaluating multiple listings and need a fast way to rank which properties are worth a deeper look
Out-of-state investors comparing properties across different markets where cap rates vary significantly
W2 earners with limited time who need to quickly narrow a list of 5-10 properties down to the 1-2 worth pursuing
Portfolio builders who want to ensure each new acquisition meets their target cap rate and return thresholds
Frequently Asked Questions
Q What format is the Cap Rate Comparison Tool?
Both Excel (.xlsx) and Google Sheets. You’ll get an instant .xlsx download plus a Google Sheets “Make a Copy” link in your purchase confirmation email. No software to install.
Q What exactly does it calculate?
For each property: Net Operating Income (NOI), cap rate, and cash-on-cash return. The sensitivity analysis shows how each metric changes with different vacancy rates, expense ratios, and rent assumptions.
Q How is this different from the Rental Deal Analyzer?
The Rental Deal Analyzer does a deep dive on a single property (cash flow, DSCR, IRR, amortization). This cap rate comparison tool is for quick side-by-side ranking of multiple properties. Many investors use both — the comparison tool to shortlist, then the Deal Analyzer to go deep on the top picks.
Q Can I compare properties in different markets?
Yes. Each property row is independent. Compare a duplex in Cleveland with a single-family in Memphis and a fourplex in Indianapolis — the tool handles it all.
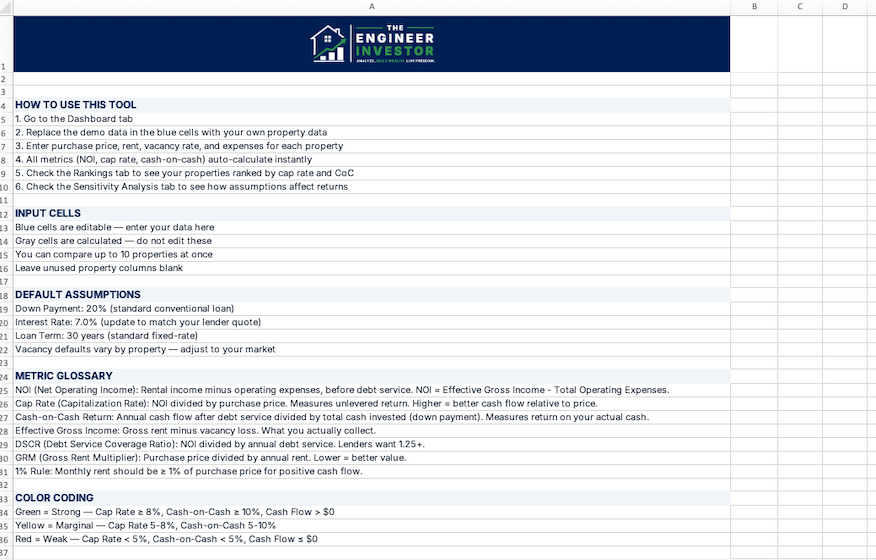
Q Do I need real estate experience to use this?
No. The tool includes built-in instructions, a glossary of terms, and pre-loaded demo data so you can see exactly how it works before entering your own numbers.
Q Is there a refund policy?
Because this is a digital product, all sales are final. But if you run into any issues, email contact@theengineerinvestor.co and we’ll make it right.
You Might Also Like
Rental Deal Analyzer
Model cash flow, cap rate, cash-on-cash return, and DSCR for any rental property.
Rental Returns Bundle
Deal Analyzer + Cap Rate Tool + Cash Flow Guide — three products, one discounted price.
Market Comparison Sheet
Compare up to 10 markets side-by-side with auto-calculated cash flow, weighted scoring, and color-coded rankings.
Stop Guessing Which Property Is the Better Deal
For $19, you get a reusable cap rate comparison tool that ranks every property by the numbers — not by gut feeling.