Rental Deal Analyzer — Stop Guessing, Start Analyzing.
The rental deal analyzer I use to evaluate every deal. Plug in your numbers, get instant clarity on whether a property will actually cash flow.
Choose Your Rental Deal Analyzer
Both versions include Excel (.xlsx) and Google Sheets formats with pre-loaded demo data so you can see exactly how it works.
Rental Deal Analyzer
Clean, focused, beginner-friendly. Everything you need to evaluate a single rental property deal.
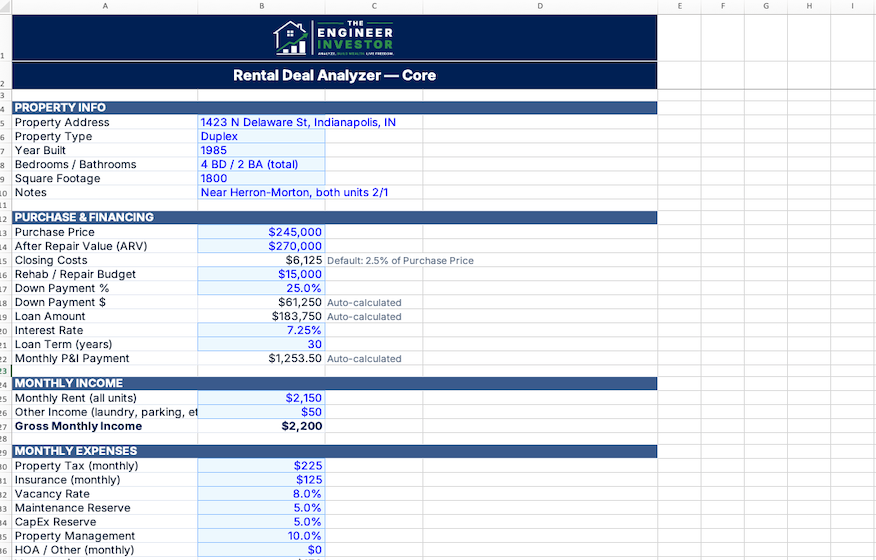
- ✓ Full Dashboard with auto-calculated metrics
- ✓ NOI, Cap Rate, Cash-on-Cash, DSCR
- ✓ 1% Rule and 50% Rule quick checks
- ✓ Color-coded results (green/yellow/red)
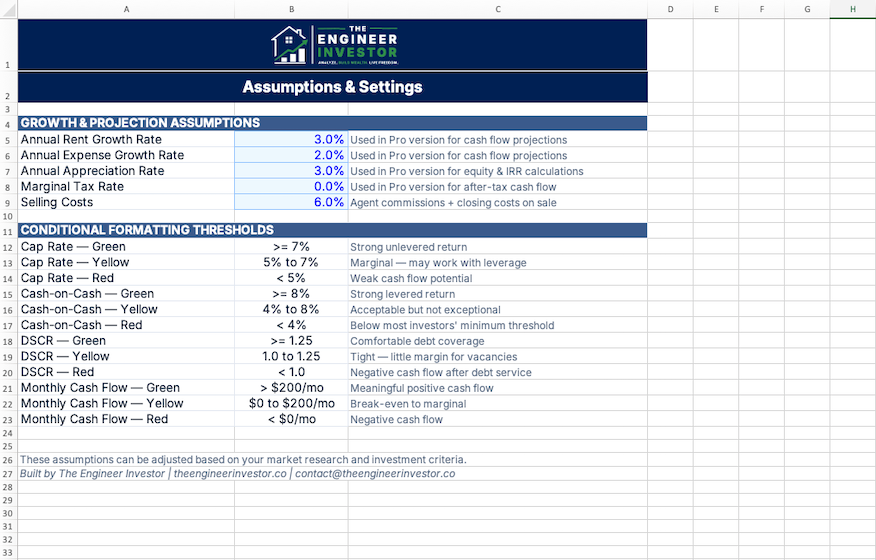
- ✓ Editable assumptions with smart defaults
- ✓ Built-in instructions and glossary
- ✓ Works for any property type (SFR to multi)
Rental Deal Analyzer Pro
The full analysis suite for serious investors. IRR, amortization, tax impact, sensitivity analysis, and multi-property comparison.
- ✓ Everything in Core, plus:
- ✓ 30-year loan amortization schedule
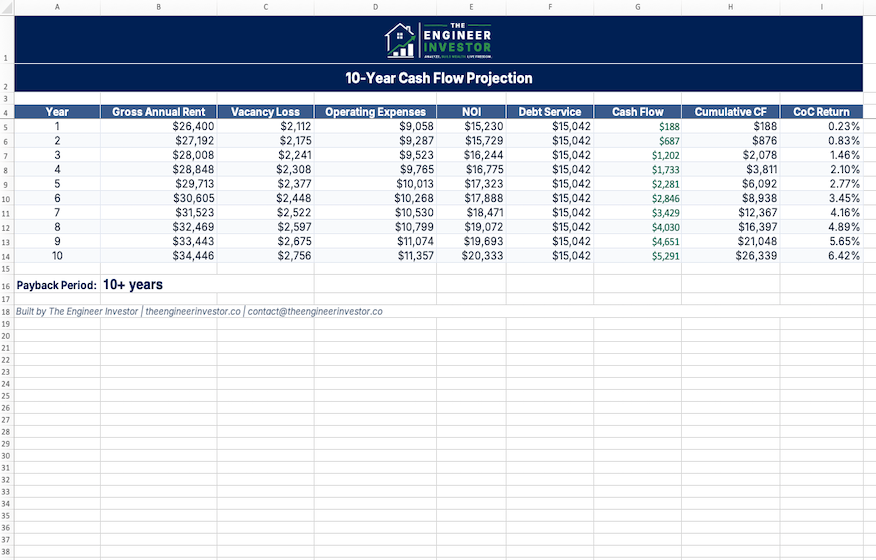
- ✓ 10-year cash flow projection
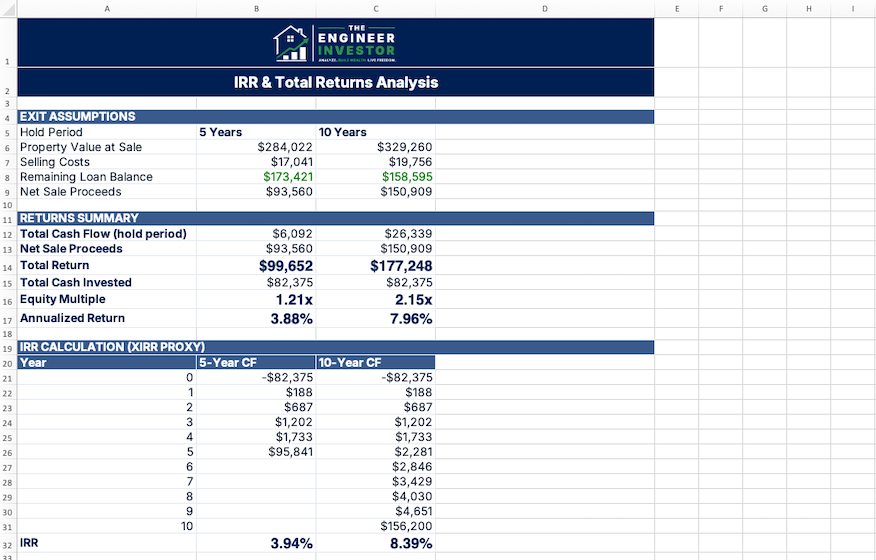
- ✓ IRR & total return analysis (5yr + 10yr)
- ✓ Equity buildup tracker with chart
- ✓ Tax impact with depreciation calculator
- ✓ Sensitivity analysis (vacancy, rent, rates)
- ✓ Compare up to 5 properties side-by-side
Core vs. Pro — Side by Side
Not sure which version you need? Here’s exactly what’s in each.
| Feature | Core ($29) | Pro ($49) |
|---|---|---|
| Dashboard & Inputs | ||
| Property info, financing, income, expenses | ✓ | ✓ |
| Auto-calculated mortgage payment (PMT) | ✓ | ✓ |
| Color-coded results dashboard | ✓ | ✓ |
| Key Metrics | ||
| NOI, Cap Rate, Cash-on-Cash Return | ✓ | ✓ |
| DSCR (Debt Service Coverage Ratio) | ✓ | ✓ |
| 1% Rule and 50% Rule checks | ✓ | ✓ |
| Rent-to-Price Ratio | ✓ | ✓ |
| Supporting Tabs | ||
| Instructions & glossary | ✓ | ✓ |
| Editable assumptions & thresholds | ✓ | ✓ |
| Advanced Analysis (Pro Only) | ||
| 30-year loan amortization schedule | — | ✓ |
| 10-year cash flow projection | — | ✓ |
| IRR & total return analysis | — | ✓ |
| Equity buildup tracker + chart | — | ✓ |
| Tax impact & depreciation calculator | — | ✓ |
| Sensitivity analysis matrices | — | ✓ |
| Compare up to 5 properties side-by-side | — | ✓ |
| Format & Delivery | ||
| Excel (.xlsx) download | ✓ | ✓ |
| Google Sheets (Make a Copy link) | ✓ | ✓ |
| Pre-loaded demo data | ✓ | ✓ |
| Free updates | ✓ | ✓ |
See What’s Inside
Professionally designed, formula-driven, and ready to use out of the box.
How It Works
Use this rental deal analyzer to go from download to decision in under 15 minutes.
Enter Your Numbers
Plug in the purchase price, rent, expenses, and financing terms. Blue-highlighted cells show you exactly where to input data.
Review the Metrics
Every key metric auto-calculates instantly. Color-coded results tell you at a glance whether the deal is strong, marginal, or weak.
Make Your Decision
Adjust inputs to model different scenarios. Change the price, rent, or down payment to find the terms that make the deal work.
Built For Investors Who Do the Math
First-time investors evaluating their first rental deal and want to make sure the numbers actually work
W2 earners looking to build passive income through real estate without quitting their day job
BRRRR strategists who need to model ARV, rehab costs, and refinance scenarios quickly
Scaling investors comparing multiple properties and need side-by-side analysis to pick the best deal
Frequently Asked Questions
Q What formats are included?
Both Excel (.xlsx) and Google Sheets. You’ll get an instant .xlsx download plus a Google Sheets “Make a Copy” link in your purchase confirmation email. Use whichever you prefer.
Q Do I need Excel or can I use Google Sheets?
Either works. The spreadsheet is fully functional in both Excel (desktop or online) and Google Sheets. All formulas, conditional formatting, and calculations work in both.
Q Will this work for single-family, duplexes, and larger multifamily?
Yes. Enter your total monthly rent for all units combined. The analyzer works for any residential rental property regardless of unit count.
Q What’s the difference between Core and Pro?
Core gives you the essential metrics (NOI, Cap Rate, Cash-on-Cash, DSCR) on a single dashboard. Pro adds 7 additional analysis tabs: amortization, 10-year cash flow projection, IRR, equity buildup, tax impact, sensitivity analysis, and a multi-property comparison tool.
Q Can I upgrade from Core to Pro later?
Yes. If you start with Core and want to upgrade, email us and we’ll credit your $29 toward the Pro purchase.
Q Are updates included?
Yes. When we update the spreadsheet (new features, formula improvements, UI refinements), you’ll get access to the updated version at no extra cost.
Q Is there a refund policy?
Because this is a digital product, all sales are final. But if you run into any issues, email contact@theengineerinvestor.co and we’ll make it right.
You Might Also Like
Cap Rate Comparison Tool
Compare cap rates across up to 10 properties with automated NOI calculations and sensitivity analysis.
W2-to-Investor Blueprint
The step-by-step guide for high-income W2 earners building wealth through rental real estate.
Rental Returns Bundle
Deal Analyzer + Cap Rate Tool + Cash Flow Guide — three products, one discounted price.