Market Comparison Sheet — Compare Markets Like an Engineer.
The market comparison sheet that lets you score, rank, and compare up to 10 real estate markets side-by-side. Data-driven market selection so you invest where the numbers actually work.
Choose Your Version
Both versions include Excel (.xlsx) and Google Sheets formats with 10 pre-loaded demo markets (Indianapolis, Memphis, Cleveland, Birmingham, Kansas City, Detroit, Little Rock, San Antonio, Huntsville, Columbus).
Market Comparison Sheet
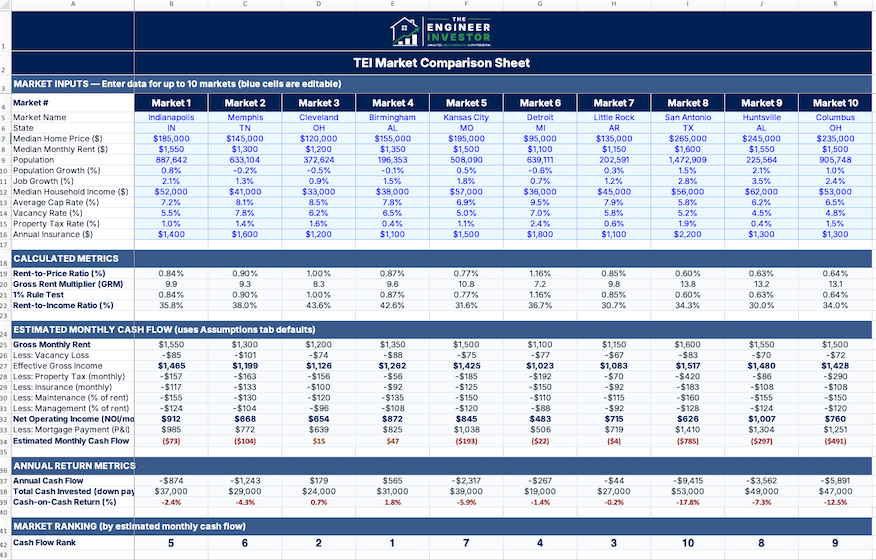
Compare up to 10 markets with auto-calculated cash flow estimates, color-coded results, and instant rankings.
- ✓ Dashboard with 10 market columns
- ✓ 12 input metrics per market
- ✓ Auto-calculated rent-to-price, GRM, cash flow
- ✓ Color-coded results (green/yellow/red)
- ✓ Cash-on-cash return and ranking
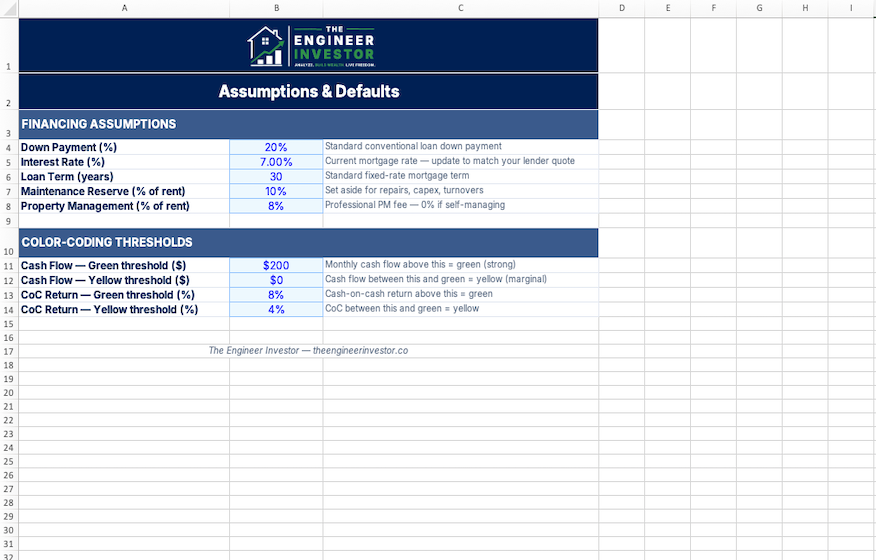
- ✓ Editable financing assumptions
- ✓ Instructions tab with data sources
Market Comparison Sheet Pro
The complete market analysis suite. Weighted scoring, detailed cash flow, sensitivity analysis, trends tracking, and a printable summary.
- ✓ Everything in Core, plus:
- ✓ Weighted scoring matrix (7 factors)
- ✓ Cash flow deep dive per market
- ✓ Sensitivity analysis (rates, down pmt, rent)
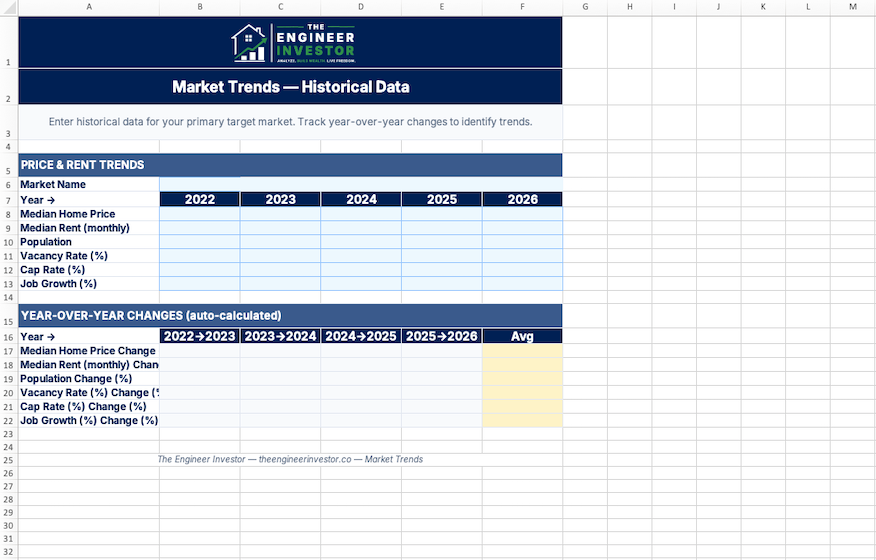
- ✓ Market trends & historical tracking
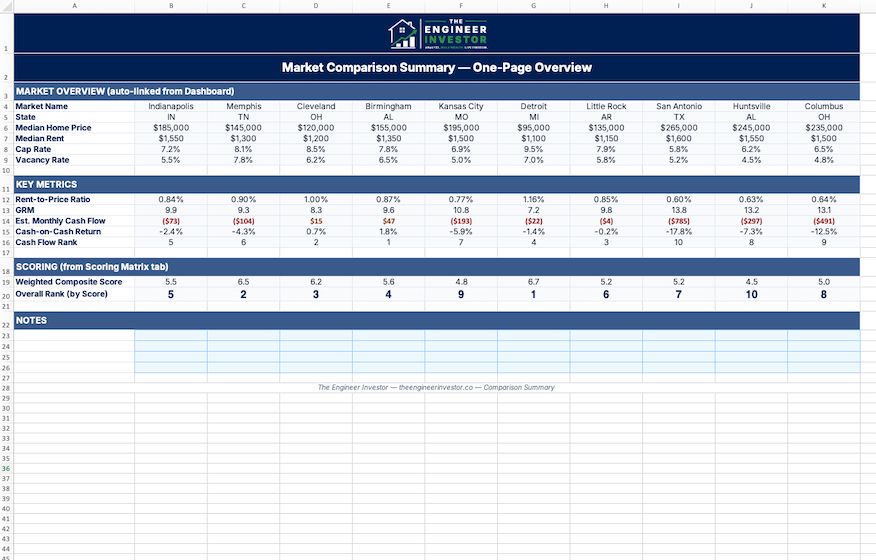
- ✓ One-page printable comparison summary
- ✓ 8 professional tabs total
Core vs. Pro — Side by Side
Not sure which version you need? Here’s exactly what’s in each.
| Feature | Core ($19) | Pro ($29) |
|---|---|---|
| Dashboard & Inputs | ||
| Compare up to 10 markets side-by-side | ✓ | ✓ |
| 12 input metrics per market | ✓ | ✓ |
| Color-coded results dashboard | ✓ | ✓ |
| 10 demo markets pre-loaded | ✓ | ✓ |
| Calculated Metrics | ||
| Rent-to-price ratio & 1% rule check | ✓ | ✓ |
| Gross rent multiplier (GRM) | ✓ | ✓ |
| Monthly cash flow estimate | ✓ | ✓ |
| Cash-on-cash return | ✓ | ✓ |
| Auto-ranking by cash flow | ✓ | ✓ |
| Supporting Tabs | ||
| Instructions & data source guide | ✓ | ✓ |
| Editable assumptions (down pmt, rate, term) | ✓ | ✓ |
| Advanced Analysis (Pro Only) | ||
| Weighted scoring matrix (7 factors, custom weights) | — | ✓ |
| Cash flow deep dive with model property | — | ✓ |
| Sensitivity analysis (interest rate, down pmt, rent) | — | ✓ |
| Market trends & historical data tracking | — | ✓ |
| One-page printable comparison summary | — | ✓ |
| Format & Delivery | ||
| Excel (.xlsx) download | ✓ | ✓ |
| Google Sheets (Make a Copy link) | ✓ | ✓ |
| Pre-loaded demo data (10 markets) | ✓ | ✓ |
| Free updates | ✓ | ✓ |
See What’s Inside
Professionally designed with color-coded results, auto-rankings, and 10 pre-loaded markets ready to go.
How It Works
Use this market comparison sheet to go from download to ranked markets in under 20 minutes.
Enter Market Data
Plug in median home price, rent, population, job growth, and other key metrics for each market. Blue cells show you exactly where to input.
Review Rankings
Cash flow, rent-to-price ratios, and rankings auto-calculate instantly. Green means go, red means dig deeper before investing.
Pick Your Market
Compare results side-by-side, run sensitivity analysis, and identify which markets hold up under stress. Then start analyzing deals.
Built For Data-Driven Market Selection
Out-of-state investors researching which markets offer the best cash flow for long-distance investing
Analytical investors who want a data-driven framework instead of chasing the latest market hype
First-time investors narrowing down from a long list of potential markets to their top 2-3 targets
W2 earners with limited time who need a structured way to compare markets quickly and confidently
Frequently Asked Questions
Q What data do I need to fill in?
For each market: median home price, median rent, population, population growth %, job growth %, median household income, cap rate, vacancy rate, property tax rate, and average insurance cost. The Instructions tab lists free data sources (Census, Zillow Research, BLS) for every metric.
Q How many markets can I compare?
Up to 10 markets side-by-side. The sheet comes with 10 pre-loaded demo markets so you can see how it works immediately.
Q What formats are included?
Both Excel (.xlsx) and Google Sheets. You’ll get an instant .xlsx download plus a Google Sheets “Make a Copy” link in your purchase confirmation email.
Q What’s the difference between Core and Pro?
Core gives you the Dashboard with rankings, cash flow estimates, and color-coded results (3 tabs). Pro adds 5 more tabs: weighted scoring matrix, cash flow deep dive, sensitivity analysis, market trends, and a printable comparison summary.
Q How does the weighted scoring matrix work?
You assign weights to 7 factors (rent-to-price ratio, cap rate, job growth, population growth, vacancy, tax rate, and GRM). The sheet normalizes each market’s data to a 1-10 scale, applies your weights, and produces a composite score. You control what matters most.
Q Can I upgrade from Core to Pro later?
Yes. Email us and we’ll credit your $19 toward the Pro purchase.
Q Is there a refund policy?
Because this is a digital product, all sales are final. But if you run into any issues, email contact@theengineerinvestor.co and we’ll make it right.
You Might Also Like
Rental Deal Analyzer
Model cash flow, cap rate, cash-on-cash return, and DSCR for any rental property.
Cap Rate Comparison Tool
Compare cap rates across up to 10 properties with automated NOI calculations and sensitivity analysis.
Portfolio Scaling Roadmap
Strategic guide to scaling from 1 to 10+ properties. Covers BRRRR, financing, delegation, and portfolio management.